The past couple of days have been quite busy out at the Conway Robinson State Forest. Every 10 years the Virginia Department of Forestry revaluates their state forests and creates a new management plan for the next decade based on the conditions found. Management plans are designed to help improve, maintain, and/or enhance the various aspects of the forest, such as wildlife habitat, natural beauty, timber income, recreational opportunities, soil erosion control, water quality, etc.
To write the management plans an inventory of the trees on the property must be taken. It would nearly impossible to measure and account for every tree in the 450 acre forest, so a pre-determined plot points are mapped using an 8 chains by 8 chains grid system (1 chain is equivalent to 66 feet. Chains are a common form of measurement when traversing between points.). This allows for a large sampling of the forests composition to be recorded and used in decision-making.
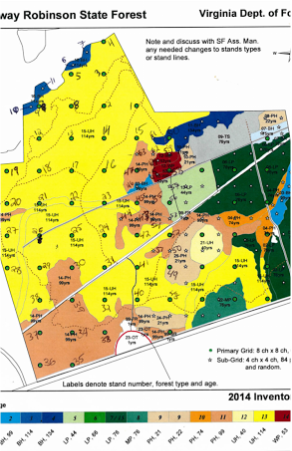
Here is the map we use to find the plots. Each green dot is a plot. The stars are extra plots we put in to have a greater sampling of certain stand types.
All of the trees within the plot radius are classified by species and what product type they could be used for (saw timber v. pulpwood), and then measured for diameter (at breast height (DBH), which is approximately 4.5 ft.), height (in logs for saw timber or bolts for pulpwood), and percent deduction (if the tree has a lot of knots or a crook in its trunk, which decrease the value).
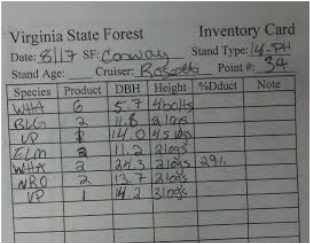
Here is an example of the data collected at each plot.
However plots do not have a set radius. The reasoning behind this can get pretty technical so I’ll try to stick to the basics. A wedge-shaped prism is used to estimate the basal area of a group of trees by counting trees which are "in" or "out" of the plot. The prism is held, usually at an arm’s length away from the eye with the bottom edge parallel to the ground, over the plot center. Trees are sighted through the prism at 4.5 ft. A tree is an "in" tree if the image in the prism overlaps the actual tree, and “out” if the prism-image and tree do not touch.
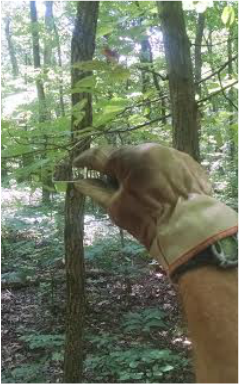 This tree is "in" and will be counted in the inventory. | 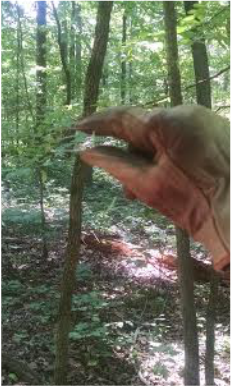 This tree is "out" so it will not be counted in the inventory. |
When the prism-image and tree align perfectly it is considered “borderline” and DBH must be measured to determine if it should be counted; foresters use a chart that shows the max distance a tree of a particular DBH can be away to still be considered “in.”
Over the course of a few days Joe and I have finished 60 plots, which is more than halfway done!
Once all of the plots have been recorded the State Forester and the Regional Senior Forester will write up a new plan based on the data we recorded and how it has changed since the last inventory. This same process will be repeated in 2015 and the same plot point will be used!
During our travels through the trails we found a few beautiful wildflowers!
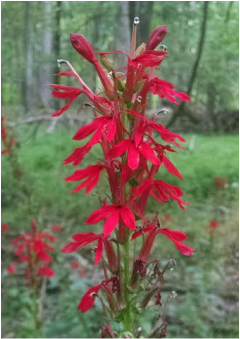 A Cardinal Flower (Lobelia cardinalis L.) | 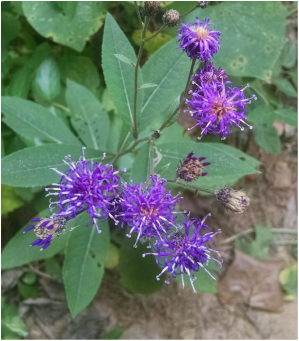 Still trying to ID this one. |
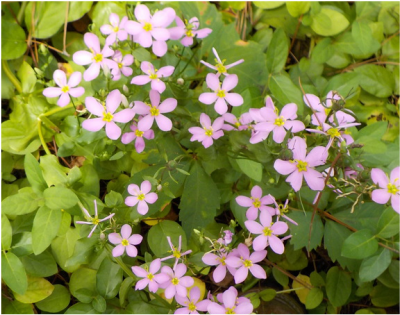
I believe this is a Rose Pink (Sabatia angularis).
 RSS Feed
